Semantic Clouds for the Visualization of Textualized Matter

In the scientific community, importance is placed on publication, authorship, and citation of research findings. This project generated an interactive visualization of scientific journals to explore the patterns with bibliometric graphs. The resulting visualization is intended to provide insights about importance among publications, authors, and documents.

Exploration of a Collaborative Platform for UX Design and Evaluation

In ethnographic design with groups of domain experts, the Group Elicitation Method (GEM) is used to facilitate dynamic interaction and participation around a specific design question with the aim of generating creative innovations.

This research project outlines an enhanced version of the GEM, which is purposefully designed to boost the effectiveness and efficiency of the traditional method while enhancing the experiences of the facilitator and participants. The enhanced GEM leverages the Internet and digital media to reduce implementation costs, increase the reusability of assets, enable remote participation, and archive results from multiple GEM sessions for comparison.

The web application, which encapsulates the enhanced GEM procedure, utilizes instructional videos to guide the process as well as gamification concepts such as avatars, progress bars, stages, and points to motivate participants. A subjective rating tool and objective metrics are used to comparatively test the enhanced GEM against the traditional GEM. The results of the comparative analysis are discussed to inform recommendations.

Features of the enhanced GEM include:

  • Micro-tweeting – creating viewpoints with concise, empathetic statements
  • Collaborative brainwriting – elicitation & refinement of viewpoints from multiple perspectives
  • Auto-scribing – self-documentation of questions and comments during concept categorization for the question-and-answer session.

Student-Centered Design Optimizations of Course Management & Teaching at Florida Tech

Abstract

This report explores how course management and teaching can be optimized to enhance the success of graduate students at Florida Tech. An anonymous student questionnaire was used to elicit common trends and perceptions within the context of student engagement, learning outcomes and effective teaching practices. Graduate students rated their interactions with faculty and teaching practices as the main contributors to their engagement. Responses demonstrated a proclivity for learning and communicating with technology. Empirical evidence supported the hypothesis that students used Canvas® as a course management system; however, there were numerous responses which suggested that some faculty members have been resistant to, or have underutilized, the course management system. Based on the results from the questionnaire, and suggestions from operational staff at Florida Tech, this report concludes with the recommendation of specific human-centered design optimizations, which were evaluated by a team of graduate students.


Introduction

This report constitutes part of a team research project for the Organizational Management and Design course in the Human-Centered Design Institute. This report focuses on course management and teaching at Florida Tech primarily from a graduate students’ perspective. There are several concepts related to student achievement and learning outcomes. The report concludes with optimizations for a human-centered redesign of some key processes, events and activities that are related to course management and teaching at Florida Tech.

About Florida Tech

Florida Tech is a private, co-educational university in the USA. The Fall 2017 enrollment at Florida Tech’s main campus in Melbourne comprised 3,446 Bachelor’s students, 938 Master’s students and 561 Doctoral students (Office of Institutional Research 2017). Florida Tech is credited with having a personalized learning environment since the student to faculty ratio is 14:1 based on 4,665 students and 339 faculty (Office of Institutional Research 2016). In 2016, 80% of classes had less than 30 students (The College Board 2016). These advantages allowed students to work closely within teams and receive personalized attention from professors.

Course Management Systems

Students view courses through the University Catalog on web pages and in printed format. The Panther Access Web System (PAWS) enables students to register, add and drop courses via the web. Florida Tech has adopted Canvas® as its course management system (CMS). Canvas® provides a framework of software tools for students and faculty to interact with each other, course materials, assignments and grades. At Florida Tech, course delivery through Canvas® is not mandatory for faculty; however, students may benefit from consistent usage of the CMS. In spite of the advantages associated with CMSs, universities may face resistance to technology integration from faculty (Howard 2013; Jeffrey et al. 2014; Howard and Gigliotti 2016; Hulme and Winstone 2017). Florida Tech students access Canvas® with a TRACKS single sign-on account.

Teaching Practices & Student Engagement

At Florida Tech, instructors use a range of teaching practices which includes lectures, in-class activities, demonstrations, printed materials, videos and website references. Assessments generally take the form of assignments, labs, exams, quizzes, projects and presentations. In the research literature on higher education, there is consensus that student engagement has a strong positive correlation with student achievement (Zilvinskis et al. 2017; Kahu 2013; Oliver et al. 2008). This report sought to uncover which teaching practices were preferred by graduate students and were likely to boost engagement thereby positively impact their learning outcomes. The research hypothesis is that student engagement varies according to the compatibility between their preferences and the teaching and assessment methods selected by faculty.


Methodology

Informed Consent and IRB Requirements

Documentation for the Institutional Review Board (IRB) was prepared (IRB 2017). The research questionnaire was voluntary, anonymous and solely conducted with the informed consent from the student participant. The confidential research questionnaire had no risks associated with it, was specific to graduate students, and was relevant to staff involved in Graduate programs.

Anonymous Student Questionnaire

The goal of the anonymous student questionnaire was to discover reliable patterns related to course management and teaching at Florida Tech. The questionnaire incorporated engagement indicators from a modified and abridged version of the National Survey of Student Engagement (NSSE), which has been completed by approximately 6 million university students (NSSE 2017). The questionnaire was conducted using (1) face-to-face introductions where the researcher randomly approached students and asked if they were graduate students willing to participate in the research study, and (2) an online invitation in a WhatsApp channel and an OrgSync group where the researcher asked colleagues for assistance with the research study. If the student accepted to participate and agreed to the informed consent form, the researcher used a computer and web browser to share a readable hyperlink to a web-based form.

Interviews with Operational Staff

Four semi-structured interviews were conducted with the following Florida Tech staff:

  • Jared Campbell (Instructional Technologist)
  • Eric Donath (Canvas Administrator and Instructional Programmer/Analyst)
  • Liz Fox (Director of Catalog and Graduate Information)
  • Oscar Williams (Director of Technical Support Center)

At the beginning of each interview, the researcher was introduced as a graduate student who was conducting a research study as part of a coursework in Organizational Management and Design at the Human-Centered Design Institute of Florida Tech. Initial responses from the student questionnaire were used as a basis for formulating the interview questions.

Evaluation of Improvements

The results from the interviews were used to provide a preliminary validation of the improvements that were elicited from the questionnaire. Further, a sample of “expert” graduate students evaluated the final list of improvements using an importance rating scale. The sample of graduate students also provided suggestions related to the risks and feasibility challenges associated with the implementation of the proposed list of improvements.


Results

Responses from Student Questionnaire

The student questionnaire was conducted at Florida Tech for two weeks between 6 November, 2017 and 20 November, 2017. There were 26 responses from 21 (80.8%) males and 5 (19.2%) females who originated from Africa (3), Asia (10), Caribbean (5), Europe (2), North America (5) and South America (1). All students responded to the 15 questions that focused on student engagement, course satisfaction and technology habits.

In terms of Colleges and Departments, 21 (76.9%) were from the College of Engineering and Computing, 2 from the College of Science, 2 from the College of Business and 1 from the College of Psychology and Liberal Arts. The students were required to rate their level of experience using a personal computer on a scale of advanced, intermediate, novice and none. Of the 26 respondents, 15 (57.7%) rated themselves advanced, 10 (38.5%) as intermediate and only 1 (3.8%) person stated that they have no experience using a personal computer.

Results from Staff Interviews

The general results from the interviews are presented in the following Table 1.

Interviewee

Results

Jared Campbell
Instructional Technologist
  • Canvas® adoption challenges
  • Course management technologies
  • CMS improvement plans
Eric Donath
Canvas Administrator & Instructional Programmer/Analyst
  • Canvas® gamification concepts
  • Canvas®-related support requests
  • Canvas® support channels
Liz Fox
Director of Catalog & Graduate Information
  • Courses offered at Florida Tech
  • Digital catalog system called aCalog
  • Policy management system
Oscar Williams
Director of Technical Support Center
 
  • Technology Support Center requests


Table 1 – Results from Staff Interviews


Findings

Likert scales used in the questionnaire were presented using ordinal labels with associated numerical weights. In the analysis, weights for each option were summed and computed as percentages of the maximum possible sum. These percentages were used to rank the options.

Student Satisfaction with Courses

The ratings of satisfaction with courses were positively skewed with 73% in agreement and only 7.7% expressing dissatisfaction. There were 19.2% of the students who maintained a neutral position on satisfaction with their courses.

Student Engagement Indicators


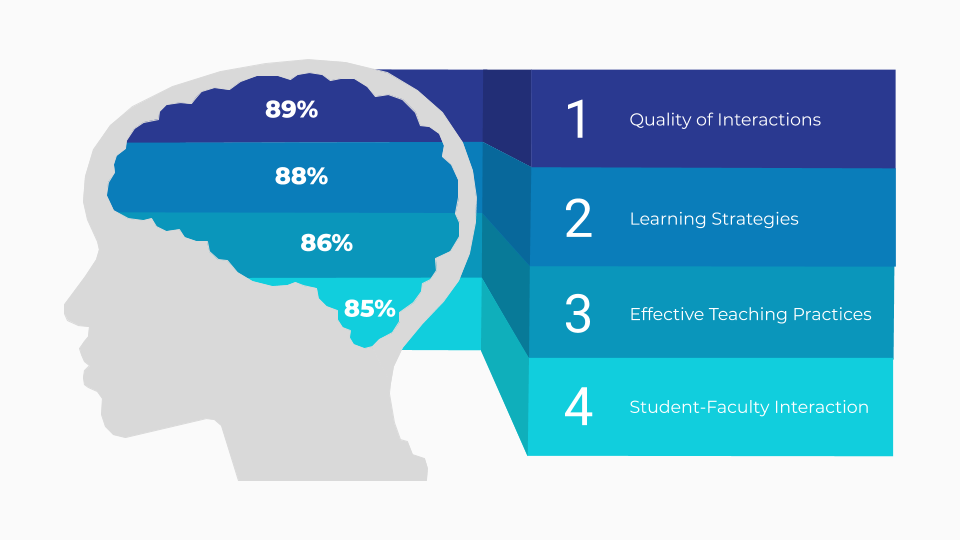
The 10 student engagement indicators ranked by their percentage weights were as follows:

  1. Quality of Interactions (89%)
  2. Learning Strategies (88%)
  3. Effective Teaching Practices (86%)
  4. Student-Faculty Interaction (85%)
  5. Higher Order Learning (85%)
  6. Collaborative Learning (85%)
  7. Discussions with Diverse Others (83%)
  8. Reflective & Integrative Learning (83%)
  9. Quantitative Reasoning (82%)
  10. Supportive Environment (82%)

Students generally felt that high quality interactions and supportive relationships were most engaging. The highly rated personal learning strategies used by students implied that students were actively engaging with course material. Effective teaching practices and experiences with faculty members were not surprisingly rated very high. Additionally, higher order learning was rated on par with collaborative learning as more engaging than quantitative reasoning, which implies that students were more likely to be engaged with evaluation, synthesis, analysis, and interpretation rather than simply absorbing knowledge facts, names and numbers.

Effective Teaching Practices


The 12 selected teaching practices ranked by their percentage weights were as follows:

  1. Projects (88%)
  2. Assignments (84%)
  3. In-class activities (82%)
  4. Lectures (82%)
  5. In-class demonstrations (80%)
  6. Video tutorials (80%)
  7. Websites (79%)
  8. Online knowledge base (79%)
  9. Learning management system (75%)
  10. Exams (75%)
  11. Printed materials (71%)
  12. Quizzes (70%)

Analysis of teaching practices from the students’ perspective revealed the effectiveness of practical “knowledge pull” methods (projects, assignments, in-class activities) superseded the more passive “knowledge push” methods (lectures, in-class demonstrations and video tutorials).

Technology Contribution to Courses

Students confirmed that technology contributed significantly to their learning, studying, or completing coursework on their own as well as with other students . Even though this finding related to technology was positive, 100% of the students admitted that technology distracted them to some extent from completing their coursework. 57% of the students stated that this distraction was quite a bit (19%) and very much (38%). This finding is of concern and should be investigated further in order to moderate the adverse impact of technology on coursework.

Frequency of Technology Usage


In order to understand how often students were using technology, 8 different technologies were surveyed. The technologies ranked by their percentage weights were as follows:

  1. Mobile computing (92%)
  2. Course management tools (89%)
  3. Collaborative editing software (83%)
  4. Electronic textbooks (83%)
  5. Multimedia software (82%)
  6. Social networking (82%)
  7. Online portfolios (72%)
  8. Blogs (67%)

Mobile computing dominated the range of technology used. In spite of the fact that social networking ranked number 6, there were 73% of the students that used social networking often (23%) and very often (50%). Three (3) learning related technologies ranked highly within the top 4 most frequently used technologies, namely course management tools such as Canvas®, collaborative editing software such as Google Docs, and electronic textbooks. 23% of the students were unfamiliar with blogs and 12% were unfamiliar with online portfolios.

Course Management Technologies

According to Jared Campbell, Eric Donath and Liz Fox, Canvas® interfaces with other technologies in the overall course administration system. For example, courses that are managed in Canvas® may be cross-referenced from Banner®, which is a relational database used by Florida Tech for administration and enterprise resource planning. Other third-party technologies commonly used with Canvas® are listed as follows:

  • Panopto™ – for recording lectures, screencasts and video content management
  • Poll Everywhere® – for live interactive classroom participation and student responses
  • Turnitin® – for student submissions and automatically checking for plagiarism

Mrs. Fox described the university’s endeavor to synchronize course catalog content and various policies through a single source. The administration of syllabi was a common theme in the interviews with Mr. Campbell and Mrs. Fox. Both of the staff were actively implementing methods to make the process more faculty-led and faculty-friendly. The idea was to have faculty instructors easily generate their syllabi and upload them on Canvas®.

Features on Canvas® used by Students

The questionnaire revealed that 96% of the students used Canvas® for course management. The features used by these students were ranked as follows:

  1. Grades (92%)
  2. Assignments (88%)
  3. Files (88%)
  4. Announcements (76%)
  5. Syllabus (68%)
  6. People (64%)
  7. Quizzes (48%)
  8. Multimedia (44%)
  9. Discussions (36%)
  10. Chat (32%)
  11. Collaborations (24%)
  12. Conferences (16%)

It can be determined that the top 5 features used were information oriented. The communication oriented features of Canvas® were less commonly used e.g. discussions (36%), chat (32%), collaborations (24%) and conferences (16%). It is notable that the most commonly used Canvas® features were related to assessment i.e. grades and assignments.

Even though communication via Canvas® was not high, it was outstanding how much the students used technology to communicate with their peers, academic advisors, faculty and to a lesser extent with staff at student services and administration.

Student Challenges with Canvas®

From the students surveyed, 60% experienced no problems using Canvas®. In spite of the frequent usage of the CMS, some students reported common challenges. Most notably, 56% of the students reported human-related challenges i.e. 40% claimed that not all of their professors used the CMS effectively; 8% reported that their professors did not use the CMS at all; and, 8% reported that they had limited access to tech support related to Canvas®. Some of the other challenges reported included the following:

  • The CMS was unavailable when they needed it
  • The communication features were unreliable
  • Some software applications did not work properly with the CMS

Staff Perspectives on CMSs

The interviews with Jared Campbell and Eric Donath revealed that the Office of Information Technology at Florida Tech was making a concerted effort to have the Canvas® CMS adopted by all students and faculty. Mr. Campbell reported that there is no mandatory policy for the use of Canvas® even though it was recommended to faculty.

Mr. Donath suggested that gamification can be used proactively to induce greater adoption. The proposed gamification strategy involved benchmark ratings of professors within colleges and departments as a means to motivate department heads and deans to become advocates for promoting usage of the CMS among the professors.

To supplement this strategy, a basic 8-module training course called “Canvas® 101” has been deployed and made available to professors. To date, Mr. Campbell reported that approximately 173 of 339 faculty members (51%) have completed the training course on their own volition.

Additionally, the instructional technologists have developed resources such as syllabus templates and interactive web forms to assist professors with the development of well formatted, standardized syllabi. If this process becomes adopted as a best practice, students reported that they will be more satisfied, especially if the syllabus is located in Canvas® on a separate tab.

Mr. Donath stated that there were 1,907 Canvas® support requests from students and faculty between Sept 5, 2016 and Oct 9, 2017. There were approximately 200 Canvas®-related requests for administrative tasks e.g. connecting third-party apps. Canvas®-related requests can be reported to Canvas® Support 24/7 via phone, email, online support request or live chat. These support channels were accessible from the Help link in Canvas.

Mr. Oscar Williams stated that there were 13,869 student support tickets between Sept, 2016 and Oct, 2017, and 9,479 faculty/staff support tickets on the same time period. Therefore, the percentage of Canvas®-related support tickets was approximately 8.2%. This ratio supports the strategy of the Information Technology department to create Canvas®-dedicated support channels that would separate the requests from the list of general technology support requests.

The interview with Liz Fox provided insights into the process by which courses were entered into the catalog, and the challenges with synchronization of course information, syllabi and administrative policies. Ms. Fox explained the university’s advancement to supplement the printed and portable document format (PDF) catalogs with Acalog™, which is Florida Tech’s online catalog management system.

Based on information provided by Mrs. Fox, there were approximately 2,541 courses in the catalog of which 1,244 (49%) are numbered level 5000 or higher (i.e. a general indicator of courses that are intended for graduate level). Each course has a specific description, list of pre-requisite courses and syllabus. Synchronizing up-to-date information, especially syllabi in a common format posed a recurring challenge to the Registrar’s Office.


Proposed Optimizations

The participants of the questionnaire shared their ideas for improvement of the processes, events and activities at Florida Tech. These ideas were categorized into concepts which were rated by the team of graduate students. The following list of ranked optimizations emerged.


1. Real-World Learning

There should be greater emphasis on practical topics that directly apply to industry. Graduate students do not only wish to be taught but they demand learning through critical thinking and working on relevant projects and applications. Internships, co-ops and on-the-job experiences were highlighted to ensure the transfer of knowledge into industry.

2. Collaborative Learning

Related to real-world learning, teamwork and collaboration were highly important aspects of work readiness. To this end, teaching methods should comprise more collaborative projects and in-class activities that feature high order learning and peer discussion, which develop skills related to the analysis, synthesis, evaluation and creation of knowledge.

3. Gamified Assessment

Consistent practise and student engagement are imperative for continuous learning. For Millennials and Generation Xers, gamified assessments may be effective replacements of traditional homework and paper-based quizzes. These games provide prompt feedback and blend powerful learning media to reinforce difficult concepts. If these gamified assessments have minor but positive impact on grades, students may be more receptive to consume them.

4. Personalized Planning

Currently Acalog™ facilitates searching for courses and printing or downloading degree plans.
An upgrade that makes it a personalized, interactive program planner with real-time grade monitoring is proposed. By allowing students to review their cumulative progress in real-time and simulate the impact of future grades may motivate better student performance.

5. Canvas Support Package

There are Canvas® tutorials distributed all over the Internet e.g. https://vimeo.com/74677642. There is also the “Canvas 101” course that is available through the Instructional Technology department. However, students and faculty may be unaware of these support resources that are available to help them become better users. The research proposes a well promoted set of scenario-based micro-webinars and videos for students and faculty to become familiar with the CMS. Supplementary assets such as templates for syllabi and model courses may help faculty to onboard with the CMS and meet the demand of students for using the platform.


Conclusion

In this report, course management and teaching at Florida Tech was investigated using conventional surveying methods based on paradigms from higher education. The questionnaire used was proven as a reliable measure to elicit the trends and perceptions of students in relation to their preferences. The constructs used were rooted in operational definitions espoused by the National Survey of Student Engagement (NSSE 2017). The measures of student engagement, learning outcomes and effective teaching practices yielded remarkable results and findings upon which the proposed optimizations were founded.

Graduate students favored interactions with faculty and peers highly. They prefered a deeper understanding of the information that had been communicated by their professors and appeared to be keen on using technology in their learning and studying. There was significant evidence that Canvas® was being used by the students; however, the major challenges related to the adoption of the course management system resided on the side of the faculty. Donald Ely, in his seminal research of technology diffusion, identified eight main conditions that facilitate the implementation of educational technological innovations, which are relevant to Florida Tech (Ely 1990; Ely 1999). The eight conditions can be used to add structure to the implementation of the proposed optimizations.

The operational staff at Florida Tech who are responsible for course management were open to the research project. Going forward, this research suggests that they should consider the faculty as a key persona and discover more about them in relation to their (1) dissatisfaction with the status quo, (2) existence of knowledge and skills, (3) availability of resources, (4) availability of time, (5) existence of rewards or incentives, (6) participation, (7) commitment, and (8) leadership (Ely 1990; Ely 1999; Anderson 2008). The RIPPLES model has been used in higher education to successfully integrate technology, and to streamline the readiness for CMS implementation in the areas of Resources, Infrastructure, People, Policies, Learning, Evaluation and Support (Tomei, 2008).

The final list of optimizations proposed are student-centered, practical in nature, and have no substantial risks associated with them. They will, however, require buy-in from the highest administrative level to the department head level all the way down to the faculty level. With commitment, Florida Tech can enhance its course management and teaching functions in accordance with the university’s mantra – “High tech with a human touch”.


References

Anderson, C. (2008). Barriers and enabling factors in online teaching. International Journal of Learning, 14(12), 241-246.

Ely, D. P. (1990). Conditions that facilitate the implementation of educational technology innovations. Journal of Research on Computing in Education, 23(2), 298-305.

Ely, D. P. (1999). New perspectives on the implementation of educational technology
innovations. (ERIC Document Reproduction Service No. ED4277775).

Howard, S. K. (2013). Risk-aversion: understanding teachers’ resistance to technology integration. Technology Pedagogy and Education, 22(3), 357-372.

Howard, S. K., & Gigliotti, A. (2016). Having a go: Looking at teachers’ experience of risk-taking in technology integration. Education and Information Technologies, 21(5), 1351-1366.

Hulme, J. A., & Winstone, N. E. (2017). Do no harm: Risk aversion versus risk management in the context of pedagogic frailty. Knowledge Management & E-Learning, 9(3), 261–274.

Institutional Review Board. (2017). Institutional Review Board (IRB) at Florida Tech. Retrieved from http://web2.fit.edu/crm/irb/.

Jeffrey, L., Milne, J., Suddaby, G. & Higgins, A. (2014). Blended Learning: How Teachers Balance the Blend of Online and Classroom Components. Journal of Information Technology Education: Research, 13, 21-140.

Kahu, E. (2013). Framing student engagement in higher education. Studies in Higher Education, (38)5, 758-773.

National Survey of Student Engagement. (2017). About NSSE. Bloomington, IN: Indiana University Center for Postsecondary Research. Retrieved from http://nsse.indiana.edu/html/about.cfm.

Office of Institutional Research. (2016). Common Data Set. Retrieved from http://web2.fit.edu/oir/documents/doc_mgr/1192/CDS_2016-2017.pdf.

Office of Institutional Research. (2017). Student Enrollment at Florida Tech. Retrieved from http://web2.fit.edu/oir/student-enrollment.php.

Oliver, B., Tucker, B., Gupta, R. & Yeo, S. (2008). eVALUate: an evaluation instrument for measuring students’ perceptions of their engagement and learning outcomes. Assessment & Evaluation in Higher Education, 33(6), 619-630.

The College Board. (2016). Annual Survey of Colleges. Retrieved from https://www.collegedata.com/cs/data/college/college_pg04_tmpl.jhtml?schoolId=882.

Tomei, L. A. (2008). Encyclopedia of Information Technology Curriculum Integration (2 Volumes) (pp. 1-1146). Hershey, PA: IGI Global. doi:10.4018/978-1-59904-881-9

Rhodes, T. & Finley, A. (2013). Using the VALUE Rubrics for Improvement of Learning and Authentic Assessment. Washington, DC: Association of American Colleges and Universities.

Zilvinskis, J., Masseria, A. & Pike, G. (2017). Student Engagement and Student Learning: Examining the Convergent and Discriminant Validity of the Revised National Survey of Student Engagement. Research in Higher Education, 58(8), 880-903.


e-GEM Phase 1 – Usability Engineering

Summarized State of the Art

Ideas are intellectual assets in the world of business, for example, the design of new products, features, processes or brand names can be protected as patents, copyrights and trademarks. But how are creative ideas generated, converted into practical knowledge, and managed to derive customer value and business intelligence?

Traditionally, focus groups and brainstorming sessions are used to elicit ideas. The main challenges of these approaches and their variants are predicated on the complex social dynamics that are inherent to group decision making. Both focus groups and brainstorms are limited by the number of participants that can contribute within a bounded timeframe and physical space. Both are synchronous, time-consuming methods that do not scale and are relatively difficult to document.

The brainwriting technique devised by Bernd Rohrbach is a more manageable and inclusive method to facilitate the generation of ideas from a group of people. Brainwriting can be used to stimulate a group of experts with the goal of silently expressing their expertise on a precise issue (Boy 1991). These subtle improvements of the brainstorming method, even though paper-based, mitigate the negative social impact while capturing the ideas in a written format.

There is conclusive evidence that knowledge elicitation as a design process can enhanced by the interactive and component-based software technology (Boy 1997). Studies comparing group performance in physical and virtual brainstorming sessions indicate that virtual sessions generate more high quality ideas and have a higher average of creative ideas per person, as well as resulting in higher levels of satisfaction with the ideas (Chamorro-Premuzic 2015b).

However, the technology-rich approach should not overshadow the awareness of the representational model that is used in the knowledge design process (Boy 1997). Human factors principles will be adopted to ensure that the participants are capable of accomplishing the goals of the ideation process. To this end, the interactions and interfaces of e-GEM will be iteratively designed and evaluated using a set of usability inspection methods.

Problem Statement

Design teams are primarily responsible for the ideation process in research and development projects whether in corporations, governments or less formal organizations. In the competitive landscape, agile methods of knowledge elicitation that satisfy the needs of end users and stakeholders are imperative.

Historically, design teams rely on feedback from disparate user groups using research methods to elicit ideas and draw conclusions for design. However, some design ideas plagued by outdated processes and infected by unavoidable politics. Consequently, these phenomena have led to inefficient design sessions as well as products that amplify the biases of the more dominant and extroverted participants from design sessions. As a result, what was supposed to be the collaborative source of cutting-edge product development insights now becomes a string of nightmares for the design team.

The set of methods outlined in Section 2.5 will be involve the target users identified in Section 2.3 to help solve these problems by allowing them to participate at various points throughout the product life cycle. This inclusive, human-centered approach will reduce the risk of creating a misaligned prototype and optimize the potential value delivered to the target users.

Identified Scenarios, Target Users, Processes and Tasks

Two realistic scenarios for the e-GEM are proposed below. The target users are members of the design team, namely the facilitator and participants. Generally, the target users are familiar with web applications, email, computers and mobile devices.


The first scenario involved a NASA design team that was seeking to answer the design question around a solar-driven drilling tool for extracting core samples and providing geological analyses that could be remotely communicated to earth. The NASA design team comprised a mixed group of geologists, astronauts and engineers that were led by a facilitator.

The second scenario involved a more “down-to-earth” research team of graduate students who sought to redesign an optimized organizational structure for delivering university services. The scenarios were not exhaustive but covered a range of e-GEM use cases involving different levels of sophistication and different group compositions (homogeneous vs. heterogeneous).

The tasks expected in the e-GEM web application were modeled from the traditional GEM, and are outlined in the following use-case diagram, which created the basis for the storyboard and wireframes explained in Section 2.5.


Proposed System

The long-term goal of this research project is to lay a foundation for an operational “Usability and UX methods bank” that can be commercialized for industrial applications.


In the more immediate case, the problem being solved is the provision of a consolidated high-tech platform for eliciting ideas from groups and conducting participatory design more cost-effectively. The solution will be a responsive web application delivers a seamless and scalable online user experience to the end users across as many concurrent devices as possible. The solution will feature an easy-to-use PHP-based MVC architecture, lightweight libraries and robust object-oriented databases. A multimedia integration will be used to provide secure, cross-platform desktop sharing with audio and video web conferencing that is scalable in the cloud through a one-time app download.

The proposed solution will help design teams to overcome the egos of participants (and their own) by leveraging anonymity, circumvent objections from stakeholders by providing a transparent and evidence-based approach to the subjective design process, and ultimately enhance the efficacy of participatory design.

Set of Methods

The following Gantt Chart contains a timeline of the major tasks associated with the analysis, design, development, evaluation and release of the e-GEM web application.


Questions, Options, Criteria (QOC) was used to make decisions on the following design questions after careful consideration of the practical options using a set of relevant criteria:

  • Which software delivery platform should be used?
  • Which web framework should be used?
  • How to integrate virtual collaboration using multimedia?

A Pilot Study was used to simulate and test the traditional group elicitation method (GEM) and establish a baseline. The test provided hands-on experience upon which an appropriate context could be founded for developing the enhanced GEM. The pilot study was unobtrusive and allowed for discovery of realistic limitations imposed by the traditional GEM.

User Personas were modeled for the key end users involved in the GEM i.e. the facilitator and the participant. Analysis of the personas yields a better understanding of the capabilities and limitations of the end users and help to contextualize their goals and likely expectations of the proposed solution. The user personas were based on generalizations and may not account for the characteristics of outliers from the norm.

The Scenario-based Design approach was used to test the suitability of the user personas and to construct two practical scenarios that would inform the development of the storyboard and wireframes. The two scenarios were summarized in Section 2.3.

A Storyboard of the solution and Wireframes of the user interfaces were used to mockup the system design in order to facilitate rapid prototyping and generate a visual representation of the proposed solution for a heuristic evaluation. The rationale for adopting the visual design approach is therefore obvious but required an in-depth analysis of the user tasks and prospective interactions with the proposed system. However, the design of wireframes required a high level of experience in web application design.

A Heuristic Evaluation of the prototype will be conducted with two to three expert GEM users in order to determine the compliance of the user interfaces with recognized usability principles, and discover usability problems so that they can be amended early in the design process. The heuristic evaluation should last two to three hours and will not be intrusive since the evaluators will complete the inspection independently then have their findings aggregated.

Finally, a Usability Test may be conducted at the end in order to provide an initial basis for comparing the enhanced GEM against the traditional GEM using objective metrics such as execution time and the number of ideas generated along with subjective measures of usability and satisfaction. A two-by-two factorial design multivariate analysis of variance (2×2 MANOVA) statistical method will be used to determine if there is significant difference between the traditional and enhanced methods. It is anticipated that the summative usability test may be time-consuming and resource intensive. Power analysis for a MANOVA with two levels and two dependent variables using an alpha of 0.05, a power of 0.80, and a large effect size (f = 0.40), requires a minimum sample size of 28 subjects, which may present a challenge. Additionally, a reliable subjective measures such as the System Usability Scale (SUS) or Questionnaire for User Interaction Satisfaction (QUIS) may be used to gain insights of usability but may produce results that are complex to interpret.

Future Work

  • Build traction for the free use of e-GEM targeting the following scenarios:
    • Student research projects
    • University administrative decisions
    • University-affiliated industry partner projects
  • Use feedback to rapidly iterate the prototype
  • Widen the scope of the e-GEM to offer a more comprehensive bank of methods
  • Network within the domain to build a community of Usability and UX practitioners
  • Research more relevant and reliable Usability Engineering and UX Design methods
  • Research licensing of the intellectual property in protected methods
  • Implement selected methods through the ubiquitous and digitally-enhanced solution
  • Copyright the code authored for the web platform
  • Commercialize the solution through marketing

Mass Production of Radiation Shields In Situ

The Radiation Problem

Acute and chronic exposure to radiation can increase risks to astronaut health and well being.


The Solution

A cost-effective prewalk robotic mission that autonomously fabricates radiation shield components for generating localized magnetospheres in order to deflect cosmic radiation and enhance well-being of astronauts and biological habitability on Mars.


How We Built It

Using design thinking and concept maps, the team collaboratively ideated the solution to meet the end goal of reducing radiation impacts on astronauts. Feasibility and Risk Analysis of fabricating the radiation shield components was utilized from a human-system integration perspective. The tools and techniques used include the following:


  • Design-thinking
  • Concept-maps
  • Idea-visualization
  • Analytical-hierarchical-processing
  • Systems-thinking
  • Human-system-integration


Challenges Encountered

The breadth and technical complexity of the system. For example, the goal setting tangible interactive system (TIS) integrated with Augmented Reality, which is illustrated below.


Accomplishments that we’re proud of

Ideation of an end-to-end system with a process that was validated by the Buzz Aldrin VR story.


Lessons Learned

The journey to Mars will take extraordinary innovation and engineering.


What’s next for Mass Production of Radiation Shields In Situ

Derivation of high level requirements that can be tested on earth first.


Active Design Documents

The Organizational Design and Management (ODM) team project is the organizational optimization and design of Florida Institute of Technology processes, events and activities from the perspective of graduate students (i.e. the FIT Optimization and Redesign).

According to Dr. Guy Boy, an Active Design Document (ADD) is an integrated and shareable prototype of the artifact that is being designed. An ADD will be used by the team members to provide incremental progress evaluations during the project until a final product emerges (Boy 2005).

The ADD will provide overall traceability from the initial project design to the creation of the proposed redesign of optimized processes, events and activities at the Florida Institute of Technology. ADDs generally account for multiple contexts of use from early in the design process to project completion. In this specific case, the ADD will facilitate interaction and cooperation among team members in the requirements engineering and quality assurance as well as the experience feedback from research subjects and stakeholders.

ADDs generally use contextual links to connect interaction descriptions (IDs) to interface objects (IOs). In this team project, the anticipated interface objects will include the initial processes, events and activities as well as the range of deliverables (Gantt Chart, Design Objectives Documentation, Survey Instruments, Subjects List, Survey Results, Data Models, Improvements List, Revised Design, Report and Presentation).

The interactions in the task space will include the research procedure that encapsulates all of the tasks required to transform the initial IOs into the final report and presentation. One focus of the interactions in the evaluation space will be the discussion of the project to identify problems and issues that lead to the design objectives and development of survey and test instruments.

After identifying subjects and conducting interviews in the activity space, the data generated will be transcribed, processed and combined to derive data models to represent the status quo. The rationalization space will be used to select improvements of the processes, events and activities at the Florida Institute of Technology.

It is noteworthy that there are two major iterations of this team project: (1) initial survey instruments to be used in the preliminary research phase, and (2) final test instruments to be used to evaluate the proposed optimizations and redesign. It is across these major iterations that ADD will be most useful to ensure interactivity, rapid communication and fast feedback from the subjects to design team. Throughout the development of the final product, the ADD will enable streamlined modification and, ultimately, adequate traceability.

The outcomes of the ADD will be comprehensive and traceable documentation in the form of a written report and a graphic presentation. These final deliverables will illustrate the design decision history throughout the team project. Similar to the Gantt Chart, the final product of the ADD will clearly depict which team members were responsible for which components, which resources were used, and account for the timeline upon which the deliverables were produced.


References

Boy, G. (2005). Knowledge Management for Product Maturity. Proceedings of the International Conference on Knowledge Capture. Banff, Canada.


Pride of Workmanship Award

As the founder of CropGuard, Troy was presented with the Pride of Workmanship Award 2017 by the Rotary Club of Barbados. CropGuard is an agriculture-centric ICT platform. It was made to build the capacity of farmers to control pests and reduce crop loss. The solution was a direct response to the CTA AgriHACK Talent Caribbean initiative and was developed under a coordinated team effort. CropGuard features a Mobile App, Web Dashboard, and an Open Data API to connect agricultural stakeholders, promote knowledge management and encourage youth in agriculture.

Embraer: A Legacy of Innovation in Aviation

On September 22, 2017, I walked into the Embraer facilities at the Melbourne plant. Embraer is a global company headquartered in Brazil with highly integrated businesses in commercial, executive and military aviation (Embraer 2017). Embraer designs, develops, manufactures and markets aircraft, and provides customer support and services. The company implements human-integrated systems, programmable automation and Kaizen to ensure the agile delivery of high quality end-to-end solutions that are customized to meet the distinct needs and preferences of their downstream customers.

Embraer was founded in 1969 by Ozires Silva who later divested executive control to dynamic entrepreneurs, Mauricio Botelho and Frederico Fleury Curado (Embraer 2017). Following its success in commercial aviation, Embraer began exploring the executive aviation market in 2000 with its Legacy jet (Embraer 2017). Embraer followed up with its popular Phenom 100 and the more robust Phenom 300, which was certified in late 2009 (Robb Report 2010). By 2017, Embraer had developed a full line of business aircraft ranging from the entry-level Phenom 100 executive jet to ultra-large cabin Lineage 1000E business aircraft.

Embraer is a complex socio-technical system, which organizes its employees into cells and business units of its corporate value chain. In 2015, the company employed 23,050 people (Statista 2017). This growth in employment represented approximately 4% since 2010. The company has adopted Kaizen as a business philosophy for continuous improvement in its business units. Under the Embraer Enterprise Excellence Program (P3E), the company functions as a lean enterprise with the goals of reducing waste (muda) of resources, maximizing productivity, and, ultimately, the endgame of total customer satisfaction.

In August 2014, Melbourne International Airport and Embraer signed a multi-year lease for a new 250,000-square-foot, three-building facility with the goal of creating 600 jobs by 2016 (Barth 2014a). Additionally in 2014, Embraer opened an engineering Center of Excellence in Melbourne with the expectation of creating more 200 jobs (Barth 2014b). One year later, Embraer expanded by building a new manufacturing facility in Titusville for the production of seating solutions creating 150 new jobs (Richardson 2015).

Embraer’s rapid growth in Florida may be enabled by (1) its relatively close proximity to Brazil; (2) the ease of logistics between Embraer’s production facilities and parts distribution centers; (3) the direct access to the Melbourne International Airport and I-94; and (4) the nearby talent markets provided by the Florida Institute of Technology, Embry Riddle Aeronautical University and the University of Central Florida.

The Melbourne plant houses aircraft assembly, painting and delivery of the Embraer’s newest line of Legacy jets including all Phenoms and some Legacy 450/500s (Barth 2014a; Trautvetter 2017). On September 27, 2017, Embraer delivered its first midsize Legacy 500 that was assembled at its Melbourne plant in Florida (Trautvetter 2017). Besides the first 2017 Legacy handover, the Florida facility has assembled and delivered two Legacy 450s and nearly 260 Phenoms (Trautvetter 2017). I was privileged to see the newly painted Legacy 500 in the flight-prep area the week before its delivery.

The Melbourne production facility (gemba) has a systematic layout with structured assembly lines for the different aircraft models. The plant layout features a range of ergonomic artifacts such as proper signage, clearly marked areas, emergency systems, a smart equipment “vending machine”, and a sorted registry for aircraft components (and possibly line replacement units).

The aircraft (gembutsu) begin from shells and major components that are shipped from Brazil and other suppliers from across the world. The procurement and logistics involved is complicated but streamlined with tremendous efficiency through Embraer’s business processes. After unpacking from the cargo bay, technicians go through step-by-step assembly so that the aircraft flows from one stage of manufacturing to another. The technicians generally work in small teams and business units that are coordinated by supervisors and managers.

Each aircraft bears a conspicuous label with a production number and other pertinent identification facts. Technicians have specialized workstations situated around the assembly lines and in close proximity to other specialists in the assembly team. Throughout the assembly line, the airframe is completed, the avionics systems are integrated along with the powerplant and other subsystems, and the interiors are fitted. At various points in the engineering process, meticulous inspections are conducted according to internal and external certification standards and regulations.

At the end of the assembly line, the aircraft are taken to a neighboring facility where they are painted. Following painting, more technical inspections are conducted in the flight-prep area. The aircraft are flight tested by experienced test pilots and engineers before delivery to their buyers. This simplified process model highlights the high degree of teamwork and human-technology integration that is required in order for Embraer to fulfill its business model. The process is very risky but Embraer utilizes process standardization techniques and risk mitigation principles to guarantee the production of safe and reliable products.

During the tour at the Embraer Engineering and Technology Center, I engaged with engineers and designers who expressed satisfaction with their jobs during the conversations that we shared. Embraer prides itself on diversity and corporate culture. The company leverages diversity as a platform for innovation, which is a hallmark of the Embraer organization. The company has a clear vision that is shared by its employees on all levels. The employees demonstrate this vision through their perseverance towards excellence, their unwavering customer service, and their boldness in creativity and sustainability.

The company motivates its employees through unique Employee Appreciation Awards that are augmented with a Global Trainee Program, an Engineering Specialization Program, a Designer Program, a Young Apprentice Program, a Learning Program For People With Disabilities, and a Good Ideas program (Embraer 2017). These programs highlight different aspects of Embraer’s people-centered approach to business. The Good Ideas program, in particular, is a gamification concept whereby employees generate valuable ideas and are meaningfully rewarded through “special” parking lots, peer recognition on visual message boards, job enrichment and other valuable perks.

In addition to the programs outlined above, Embraer conducts intensive workshops and features a corporate education model to offer continued learning as a way for its professionals to build on their expertise and support corporate growth (Embraer 2017). The training is gamified in the form of abstracted levels and challenges. For example, criteria of excellence are clearly defined and reinforced to continuously induce the gradual improvement in skills that lead to better performance. Employees earn bronze, silver and gold credentials along their academic tracks as they improve and contribute to Embraer’s process and management maturity. If that wasn’t enough to motivate employees, Embraer provides cafeterias and massages on-site.

It is not only great to work at Embraer because of the beneficial programs that it offers; the company has an impeccable reputation in the aviation industry. In the 2017 Product Support Survey by Aviation International News, magazine readers rated Embraer as the top aircraft manufacturer with the highest combined average ratings of newer and older business aircraft (Thurber 2017). Such brand recognition can motivate employees when they tell others about where they work, and can instill self-esteem and self-efficacy in the work they perform.

From the perspective of corporate social responsibility and leaving the world a better place, Embraer gives back to the community. The Embraer Foundation raises funds for social and environmental projects, and inspires employees to volunteer in local initiatives with social organizations (Embraer 2016). One jet at a time, Embraer makes a sustainable impact in the lives of its employees, customers and the environment.

During a surprise ceremony where an aircraft, which featured the name of the company’s founder, was unveiled, Mr. Silva stated “I transfer to each of you this honor for what you are doing now. You deserve this… When we put this plane as a symbol of what we are going to do for the future, I would like you to think big in that direction and continue the work you are doing with confidence.” Such an empathetic statement from the head of company gives a glimpse into the heart of Embraer. Embraer does not only make great technology in the form of aircraft; Embraer also makes great people.

References

Barth, Cindy. (2014a). Embraer bringing 600 jobs to Melbourne airport. Orlando Business Journal. https://www.bizjournals.com/orlando/news/2014/08/28/embraer-bringing-600-jobs-to-melbourne-airport.html

Barth, Cindy. (2014b). Embraer’s $24.2M Center of Excellence opens in Melbourne. Orlando Business Journal. https://www.bizjournals.com/orlando/news/2014/09/08/embraers-24-2m-center-of-excellence-opens-in.html

Embraer. (2016). Embraer Establishes Foundation in the United States. http://embraerfoundation.org/embraer-establishes-foundation-in-the-united-states/

Embraer. (2017). Award-winning History With Executive Jets. http://www.embraerexecutivejets.com/en-us/about-embraer/pages/history.aspx

Imai, Masaaki. (1986). Kaizen: The Key To Japan’s Competitive Success 1st Edition. McGraw-Hill Education.

Richardson, Matthew. (2015). Aircraft manufacturer expands in Brevard, creates dozens of jobs. https://www.bizjournals.com/orlando/news/2015/06/15/aircraft-manufacturer-expands-in-brevard-creates.html

Robb Report. (2010). Embraer Phenom 300. Robb Report. http://robbreport.com/motors/aviation/embraer-phenom-12862/

Statista. (2017). Number of Embraer employees from FY 2010 to FY 2015. https://www.statista.com/statistics/281360/number-of-employees-at-embraer/

Thurber, Matt. (2017). Product Support Survey Part 1: Aircraft. Aviation International News. https://www.ainonline.com/product-support-survey-aircraft-2017

Trautvetter, Chad. (2017). Embraer Delivers First Florida-assembled Legacy 500. Aviation International News. https://www.ainonline.com/aviation-news/business-aviation/2017-09-27/embraer-delivers-first-florida-assembled-legacy-500

Ethnographic Design

Week 3 was focused on “people-writing” or “ethno-graphy” within the context of human centered design (HCD). Ethnography is a qualitative research method that is used in social sciences to collect empirical data on peoples, cultures and societies. The purpose of ethnography in HCD is not to find out how people respond to prefabricated situations by studying narrowly defined variables, but to learn how people work and play within specific domains. For example, ethnographic design can be used to study a group of pilots and how they work in the cockpit, or a group of technicians and how they work in the aircraft maintenance facility.

Ethnographic design is premised on naturalistic observation of, and interaction with people in their environment. When designing human centered technology, the designer needs “to become” one of the participants under study. This level of involvement helps the designer to see the world through the eyes of the participants and facilitates acceptance among them. However, this intimate involvement may lead to the introduction of a “researcher bias”. To this end, ethnographic design may become relatively subjective in order to gather reliable data.

The primary purpose of fostering a relationship with the participants is to strengthen the elicitation of knowledge that can lead to a deep understanding of the motives and culture of the participants. Such elicitation exploits human nature, and leverages tendencies of humans to be honest, polite, helpful and expressive of their expertise. Therefore, effective ethnographic designers master natural conversation and interaction styles.

After laying a foundation with the basics of ethnographic design, the focus of the lecture shifted to understanding the psychology of idea generation and the dichotomous relationship between the left and right hemispheres of the brain. The right hemisphere is responsible for artistic, abstract, irrational, intuitive and subjective emotions needed to create holistic viewpoints. Whereas, the left hemisphere is responsible for logical, rational, objective and scientific reasoning that is based on facts and detail-oriented arguments.

Both hemispheres work together to facilitate divergent thinking and convergent thinking. The right hemisphere is mainly accountable for divergent thinking, which involves the brainstorming process and generation of ideas. On the other hand, the left hemisphere is mainly accountable for convergent thinking, which involves analysis and synthesis through evaluation and prioritization. In problem solving both hemispheres are involved.

As simplistic as this model may sound, there are issues that arise when multiple brains work in tandem (or people work in a group, team or organization). For instance, when problem solving among a group of experts, there can be closed minded persons – bolts need to be unlocked; some persons may tend to focus on irrelevant matters thereby failing to attend that which is important – tuning needs to eliminate interference; time management becomes a challenge – please follow the meeting timeline; and, the members as well as the group needs to build credibility incrementally – reputation is not built overnight. However, with carefully devised methods such as brainwriting (brainstorming in writing), the strengths of multiple brains can become powerful forces in the creative design thinking process.

Creativity is about risk taking and managing uncertainty. There are four (4) kinds of creativity: (1) innovation, which is an umbrella term that encapsulates most of creativity, but primarily refers to truly original thinking; (2) synthesis, which involves combining information, artifacts or people from different sources into a new pattern; (3) extension, which involves extrapolating an idea beyond current constraints and limitations; and (4) duplication, which is about improving or reusing an idea often in a new area or domain.

Risk taking is imperative to overcome uncertainty, and natural for learning to occur, especially in autodidacticism. It was suggested by Dr. Boy that when facing a risk the best thing is to be prepared. Risk taking should be progressive and incremental. The critical time in performing any activity is when the activity becomes routine. It is when the operator becomes acquainted that complacency creeps in, and an important situation catches the operator “out of the loop”.

When seeking creativity, intuition is also needed i.e. that right hemisphere activity that the philosopher Hubert Dreyfus describes as “the process that enables someone to do the appropriate thing without rationalization”. Dr. Boy cemented this concept with a story about a professional skier who uses his intuition to determine when he will take on a given slope. “When I don’t feel it, I don’t do it,” he said. Intuition involves risk taking.

Another ingredient of creativity is expressivity. Dr. Boy used a biological construct to suggest that expressivity relates to variations of a phenotype (observable trait) in entities carrying a particular genotypes (what things are made from). In the context of creativity in HCD, I gathered that the act of creative expressivity occurs when ideas or viewpoints to solve a design question are articulated from different perspectives among individuals from the same domain. For example, the range of design suggestions for improving a cabin design that can be elicited from a group of business executives. Expressivity involves risk taking.

When it comes to the activation of creativity, the method of least commitment can be applied. Dr. Boy presented two heuristics, i.e. breadth-first vs depth-first, and gave explanations of both. The analogy of searching through a knowledge tree or an nth dimensional neuronal network shows how the least commitment path may be significantly dependent on the domain. These contrasting approaches require the designer to tune tradeoffs and balances (e.g. boldness vs prudence) during the creative process. The designer should go as far as necessary into the design possibilities but retain the “meaningful” root purpose of the design question. Dr. Boy reiterated that committing too early is likely to result in patching; however, committing too late may result in too much cost and resources. Commitment involves risk taking.

In my extra reading, I came across a summary of a presentation entitled Commitment and Creativity that was conducted by Seana Moran at the August 2008: American Psychological Association. I found it very inspiring as a creative person.

Commitment involves how a person invests resources in a work role over time. Creativity is a novel, appropriate variation embraced by a field of gatekeepers that transforms the domain. What role does commitment play in the careers of 36 writers with different levels of creative influence? For the least creative, commitment compensates. They invest in the craft of writing to improve their social standing within the field. For experimentalists, commitment defies. They twist traditions to yield new meanings, which gains them increased control over their self-expression. For the most creative domain transformers, commitment impassions. They trust some beloved aspect of literature, such as a character or poetic form, to convert new minds to the wonders of the domain. (Moran 2008)

To round off the final stanza on creativity, Dr. Boy defined cultural blocks as prominent inhibitors to creativity i.e. the cholesterols of creative juices. For example, among scientists and engineers, the constant search for objectivity may block subjective and divergent thinking. Additionally, not everyone likes to take risks i.e. some persons are risk averse. The designer should remain goal driven (intentional) versus become event driven (reactive) because there is a “meaningful” root purpose of the design question.

The flow of the class evolved into the multi-phased construction of the Group Elicitation Method (GEM), which is a well-trained brainchild of Dr. Boy. “GEM is a brainwriting technique that can be computer-supported and enables contradictory elicitation of viewpoints from various (field) domain experts, augmented with a classification method that enables categorization of these viewpoints into structured concepts” (Boy 2013).

The first, and maybe most important step, is articulating the initial question. This is why I have repeated the need for the designer to establish a meaningful root purpose for the question itself i.e. start with the end goal in mind. The key challenge in this first step to overcome is proper statement construction.

The second step involves the choice of the participants. Unlike experiments that are conducted for statistical significant results, the number of participants does not have to pass a power analysis test. A wide range of GEM sessions have generated reliable results with 6 to 10 domain experts who share a common language (e.g. users, managers, and designers). 7 is the magic number! Dr. Boy reminded the class that the facilitator and his/her assistant should conduct a dry run with one or two experts prior to the actual GEM session.

The “divergent thinking” and brainwriting process requires each participant to empathetically state his/her viewpoints in clear, simple language within a given time period then circuitously make one of three actions on all of the stated viewpoints (agreement; disagreement; or new viewpoint/idea). The brainwriting process is a circular, interactive and time-based process. Numbers may be assigned to participants in order to keep their viewpoints anonymous; thereby leveling the playing field and drowning social dominance in the process.

The next steps focus on “convergent thinking” and concept categorization. A framework like AUTOS pyramid can be used to bring structure to concepts. In concept categorization, the viewpoints are treated as elements and they are organized into sets, which are concepts. There are four main processes that each element may go through in order to be categorized into a set i.e. (1) create a new set; (2) belong to a set; (3) merge multiple sets; or (4) split a set. The resulting list of sets or concepts facilitates the rationalization of the design criteria.

Using the GEM as a design method, it can be viewed as collaborative writing i.e. a process where the ontology of the domain is incrementally defined through expressed concepts and their relationships. Consensus is the summative process which consolidates the expressed design criteria. Dr. Boy proposed two ways of reaching consensus. The first option involves each participant providing a subjective priority rating on each concept, and deriving a ranked consensus along with the sums, means and standard deviations (SD) of all participants. This option is computationally simple and generally preferred. The second option involves each participant using a +1, 0 or -1 (more important, equally important or less important) to denote the relative priority for pairs of concepts, which are arranged in a triangular matrix. Again the sums, mean priorities and SDs across the concepts can be generated along with a ranked consensus. However, the results from the computed matrix can be plotted on a consensus graph, which provides information on the strength of the relations between the concepts i.e. the number of connections terminating at a concept indicates a strong consensus; whereas a concept with fewer connections depicts a weak consensus. Top concepts and lower concepts can be derived from the ranked consensus. It is noted that intermediate concepts tend to generate the most discussion among the participants. Immature concepts, which may be poorly expressed, have small SDs as opposed to contradictory concepts, which exhibit large SDs.

Among his many instantiations of the GEM, Dr. Boy commented on the impressive results generated at Air France, and later at Embraer. The GEM has been proven to facilitate parallel group interaction that enables the participatory design of knowledge. The output of the GEM is a database of ideas and viewpoints. The role and responsibilities of the facilitator were emphasized. The facilitator needs to take risks, make suggestions, and motivate the participants. The facilitator is responsible for preparing the GEM, making sure the meeting facilities are in place, conducting the meeting and capturing the process. It was noted that as a decision support tool, GEM can be used for design as well as for evaluation.

With ethnographic design under my belt, I was motivated to understand how this method could be applied in the consideration of the Internet and mobile phone technology layers. At the end of Week 3, there were several key take-aways which I’ve summarized below in an abstract for my research project to answer the design question: How can the group elicitation method be augmented using a web application?

In ethnographic design with groups of domain experts, the Group Elicitation Method (GEM) is used to facilitate dynamic interaction and participation around a specific design question with the aim of generating creative innovations. This research project outlines an augmented version of the GEM, which is purposefully designed to boost effectiveness and efficiency of the traditional method while enhancing the experiences of the facilitator and participants. The augmented GEM leverages the Internet and digital media to reduce implementation costs, increase reusability of assets, enable remote participation, and archive results from multiple GEM sessions for comparison. The web application, which encapsulates the augmented GEM procedure, utilizes instructional videos to guide the process as well as gamification concepts such as avatars, progress bars, stages and points to motivate participants. Features of the augmented GEM include: (1) micro-tweeting – creating viewpoints with concise, empathetic statements; (2) collaborative brainwriting – elicitation and refinement of viewpoints from multiple perspectives; and, (3) auto-scribing – self documentation of questions and comments during concept categorization for the question-and-answer session. At the end, a subjective ratings tool and objective metrics are used to comparatively test the augmented GEM against the traditional GEM. The results of the comparative analysis are discussed to inform recommendations. (Weekes 2017)

I also read Chapter 7 of Orchestrating Human Centered Design, which is titled Modeling and Simulation (Boy 2013). Therein, I found a summary of the GEM. Additionally, I read Dr. Boy’s articles entitled “The Group Elicitation Method: An Introduction” (Boy 1996) and “The Group Elicitation Method for Participatory Design and Usability Testing” (Boy 1997). Hurricane Irma is history; now Week 4.

References

Boy, G.A. (1997). The group elicitation method for participatory design and usability testing. Interactions, March-April, ACM, New York, pp. 27-33.

Boy, G.A. (2013). Orchestrating Human-Centered Design. Springer, U.K. ISBN 978-1-4471-4338-3, pp. 139-168.

Moran, S. (2008). Commitment and Creativity. American Psychological Association.

Intro to Organizational Design and Management – Part 2

By the end of Week 1, I had within the palm of my hands the first textbook “Orchestrating Human-Centered Design”, which was written by Dr. Boy. I had been able skim through the entire book, and started reading Chapters 1 and 2. To my fascination, the book is relatively easy to read and understand. The chapters are complemented by a plethora of tempting references, some of which I hope to traverse during a future iteration of reading the book. But for the time being, I was compelled to stay on course.

The second ODM class of Week 2 began with a focus on the crucial issue of integration. It was highlighted that integration usually takes place at the end, where subsystems are unified to ensure that the overall system operates; however, Dr. Boy emphasized that integration needs to be anticipated through a holistic design approach.

From the beginning of the enterprise integration, the right information must be identified. Deep domain knowledge is essential at this early stage and a “what-if analysis” is needed to obtain the emergent properties from the interactions among individual components. This scenario-based design approach requires a thorough understanding of the system’s complexity in order to create reliable human-in-the-loop simulations (HITLSs), which can be used to elicit and capture emergent properties ahead of use time e.g. the evaluator may be able to determine the “invisible work” done by key entities that is necessary for specific organizational “use cases” to work effectively. Successful organizations put the right information in the right place e.g. Google, SpaceX…

While discussing the need to update the information in real-time to reflect the actual state of the enterprise operation, Dr. Boy introduced the Orchestra model as a dynamic, responsive, well-connected, transversal and synchronized alternative to the traditional, linear, top-down, pyramidal, army-type model of organization. In the Orchestra model, composers (human-centered designers) utilize music theory (a common language) to develop scores (coordinated requirements), which the conductors (competent managers, scientists or engineers) to coordinate musicians (specialized workers with autonomy or automata) who play (work) collaboratively to deliver a symphony (organizational output) that the audience (end users) can consume and appreciate to their satisfaction. This musical metaphor provides a usable framework for human-systems integration (HSI). It was noted that there are basically two organizations to account for in the system design i.e. (1) the makers of the technology, and (2) the receivers of the technology. Additionally, the culture, capabilities and environments of both organizations create crucial parts of the operational context.

In order to successfully bring products to maturity, business processes must be coordinated, high level requirements obtained, incremental testing employed, and human systems integrated with the key principles of safety, efficiency and comfort.

Standardized benchmarks have be used throughout industry to compare how effective organizations were at quality assurance and continuous improvement towards mature systems e.g. ISO 9000 series and the Capability Maturity Model Integration (CMMI). However, Dr. Boy questioned whether or not a product will be mature, usable and useful if the production processes are mature for all levels according to CMMI. His answer to this question was emphatically no, and he suggested that the keys to understanding why not can be found in his new book, “Tangible Interactive Systems”.

Dr. Boy pointed out that there were at least three (3) other levels, beyond the five (5) maturity levels set out in the CMMI. These extra levels are: (1) maturity of technology itself; (2) maturity of practise including various kinds of use of the technology; and (3) maturity of the organization or society to accept the technology. These extra levels of product maturity go beyond CMMI’s techno-centric levels in order to account for user experience and organizational adoption. Dr. Boy reinforced the human centered perspective of product maturity by stating a juxtaposed relationship between product maturity and user capability i.e. the less mature the product, the more expertise was needed to use it; and, conversely, the more mature the product, the less desire, if any at all, to know about the product in order to use it.

Steve Jobs understood planned maturity of practice, and maturity of the organization and society as strategies to guarantee product adoption. Apple started development of the iPod, which was very easy to use, robust and targeting a commonplace activity such as listening to music; then Apple introduced the iPhone, which was about the same size but provided more useful functions including playing music; then Apple increased the size of the iPhone and added more processing power to create the iPad. Hence, Steve Jobs used maturity to create a coherent family of products.

As I hinted in my previous report, Dr. Boy’s lectures are artistically blended with succinct visual models and memorable stories, and his narrative of his lost iPhone illustrated a covert emergent property of a mobile phone, which may not have been apparent at design time. In this unplanned use case, Dr. Boy lost his mobile phone, and during the event he realized that the mobile phone can be a life-critical system, because of the amount of personal information stored on the device. Therefore, he said, “Always check for emergent properties for safety critical systems.”

Two other principles of product maturity include efficiency, which should be measured, and comfort, which is related to usability, aesthetics, the emotional effect of the product, and its use within the organization and environment.

The next model presented for the architect approach was the V Model. In this model, the user needs and high level requirements inform the design rationale and strategy from very early. However, care must be taken when soliciting user needs and requirements because users’ articulation of their needs may be misleading. Prototyping and HITLSs are used to iteratively test the design(s). Actually, in the “multiple V model” (MVM), Dr. Boy proposed that the sequence of small-Vs provides constant feedback loops resulting in an agile approach that supports the observation of activity, formative evaluation, modular development and progressive integration. Generally speaking, if the requirements are well done, everything else follows smoothly.

In order to describe the use of HITLSs in complex systems, Dr. Boy used the national airspace system and the exponentially increasing air traffic as an example. Some airports e.g. Atlanta are oversaturated with arriving and departing aircraft. This phenomenon has been spreading to other airports and therefore needs to be studied. One problematic question that has emerged in this complex system is, “how will air traffic controllers (ATC) organize the volume of traffic in the sky?” The ATC organization has been adapting from the inverted pyramid, and becoming more like an orchestra. After alluding to an analogy of observing the birds at the beach, Dr. Boy postulated that the birds may have sensors for detecting obstacles and “to feel the direction of the flock”. Similarly, he suggested that aircraft may be equipped with sensors for traffic awareness and collision avoidance. Dr. Boy also referenced the coordinated flight of a flock of drones being researched at the University of Pennsylvania.

Dr. Boy proposed three practical solutions to manage the unending increase in aircraft to manage: (1) to build more airports but this is expensive and not preferred; (2) to build bigger aircraft e.g. A380 but this requires organizational and infrastructural changes; and, (3) managing aircraft as a flock of birds as is being done with NextGen satellite-based technology and Single European Sky ATM Research (SESAR).

To extrapolate his initial question of drones for human transportation, Dr. Boy identified stability and gravity as compounded challenges of aviation. He stated that passive stability is basically accomplished through quadcopters, whereas active stability remains as the work function of the pilot. In my research of the EHang 184, this octo-copter has redundancy in its design and organization, and can be flown by the onboard pilot, a remote pilot through an aircraft-network interface or by automation.

A graph of the Safety Maturity Curves illustrated that since the early 1970’s there was a significant decline in the number of hull losses with conventional aircraft. Dr. Boy attributed this decline to the gain in the feedback and knowledge from prior accidents and research. Further, the graph depicted a second curve which represented hull losses with automated aircraft. As was expected, this graph generally showed a fraction of the hull losses with the automated aircraft. However, Dr. Boy identified the problem was the nature of the accidents. After a generalisation of the metrics (inverse of safety, efficiency and comfort) on the y axis, Dr. Boy highlighted that the maturity period can be determined through modeling and simulation (M&S). Knowing this maturity period is important because delivering the product to market too early will lead to an unsafe product; whereas, delivering the product too late may allow the competition to overtake.

Dr. Boy recounted on his early work with the A380 and its family of Airbus aircraft. He jokingly remarked about the interactivity of the A380’s modern cockpit through a discussion he had with a colleague. During the exchange, they noticed the shift from physical interaction in older mechanical aircraft to a style of mediated human computer interaction (HCI) that led to the pilot’s virtualized interaction with the information in the user interfaces; thereby, leading to emergence of tangibility issues related to interaction.

As the modification of technology led to more manipulative technology amidst modification of the organization and the people therein, competence remains an important factor for being able to understand the systems and their emergent properties. Even though automation is being involved to minimize errors, the systems must be designed for people to be active players in the solution; therefore, technology should allow humans to play a “sufficient” role. Dr. Boy linked this to a critical level of motivation that is needed before the human lapses into the very dangerous state of complacency.

Expanding on the topic of motivation at work, a positive correlation was noted between autonomy and performance (i.e. autonomy increased performance). Also through cultivating mastery and doing a good job, the worker feels better. However, the fundamental motive is why! It is this reason or purpose which engenders satisfaction.

As the world evolved, there have been changes in technology and media (e.g. writing) and these changes have profound impacts on society and the organization of people. The concept of authority in the organization pivots on dimensions of control and accountability. A problem arises when there are loops in the chain of control e.g. democratic voting and the election of members of parliament (MPs) by the people where the MPs would, in turn, govern the people. Who is accountable and who is in control is this circular paradigm? Likewise, in aviation, technology such as the flight management system (FMS) modifies the accountability of the pilot. The FMS therefore has an emergent property on the pilots i.e. the pilot now has to manage the FMS rather than fly the route. Also, the role of the ATC who controlled the aircraft in the airspace is now managing a complicated flock of aircraft with multiple trajectories.

The most enjoyable concept came around the end of the class i.e. Cognitive Functional Analysis (CFA). Dr. Boy described three (3) types of interaction in multi-agent systems n.b. agents could be humans or automation:

  • Supervision e.g. interaction with MS DOS where the supervisor could be artificial or even a book.
  • Mediation e.g. a “virtual desktop” or database can act as a diplomat desktop between human and computer.
  • Cooperation by common/mutual understanding e.g. professor in the classroom using Google predictive search to learning about a topic.

What reconnected all of the dots throughout Week 2 was that “emergent properties are likely to arise as changes are made between these types of interactions”. I totally agree!

With examples ranging from cars to elevators to aircraft cockpits to phones to knives, at the end of Week 2, there were several key take-aways which I’ve summarized below:

  • The main obstacle to innovation is our persistent cognitive patterns or habits
  • The Orchestra model is becoming more common due to technological influence
  • Composers may not know how to play all instruments but they integrate them
  • Product maturity is about maturity of TOP (technology, organization & practice)
  • Human centered designers design for people (not users). We are people!
  • People are highly nonlinear and unpredictably generate emergent properties
  • Emergent properties appear from the activities among the interactions of entities
  • Safety and security are important factors to test for emergent properties
  • HCD has a legal component especially with accident causation and technology

With these new concepts appended to my ODM conceptual model, I happily prepared for Week 3 by checking up on my two (2) outstanding books:

  • Tangible Interactive Systems
  • The Handbook of Human Machine Interaction

I was also eager to search for and watch the 2001 movie called “The Space Odyssey”, which was encouraged by Dr. Boy.